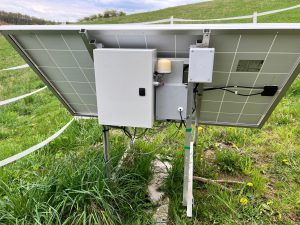
After the technical hiatus that began last November, I am happy to announce that the VLF receiver is finally fully operational again as of Saturday, April 18th. The upgrade work was extensive and required a significant amount of energy, which is why the “Pills of technique” Monday column is temporarily suspended.
The hardware changes compared to “Version 1” are substantial, transforming the system into a much more resilient and intelligent setup.

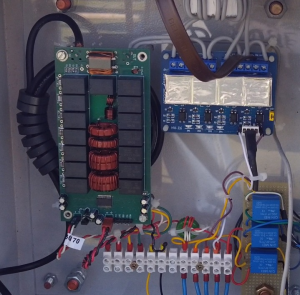
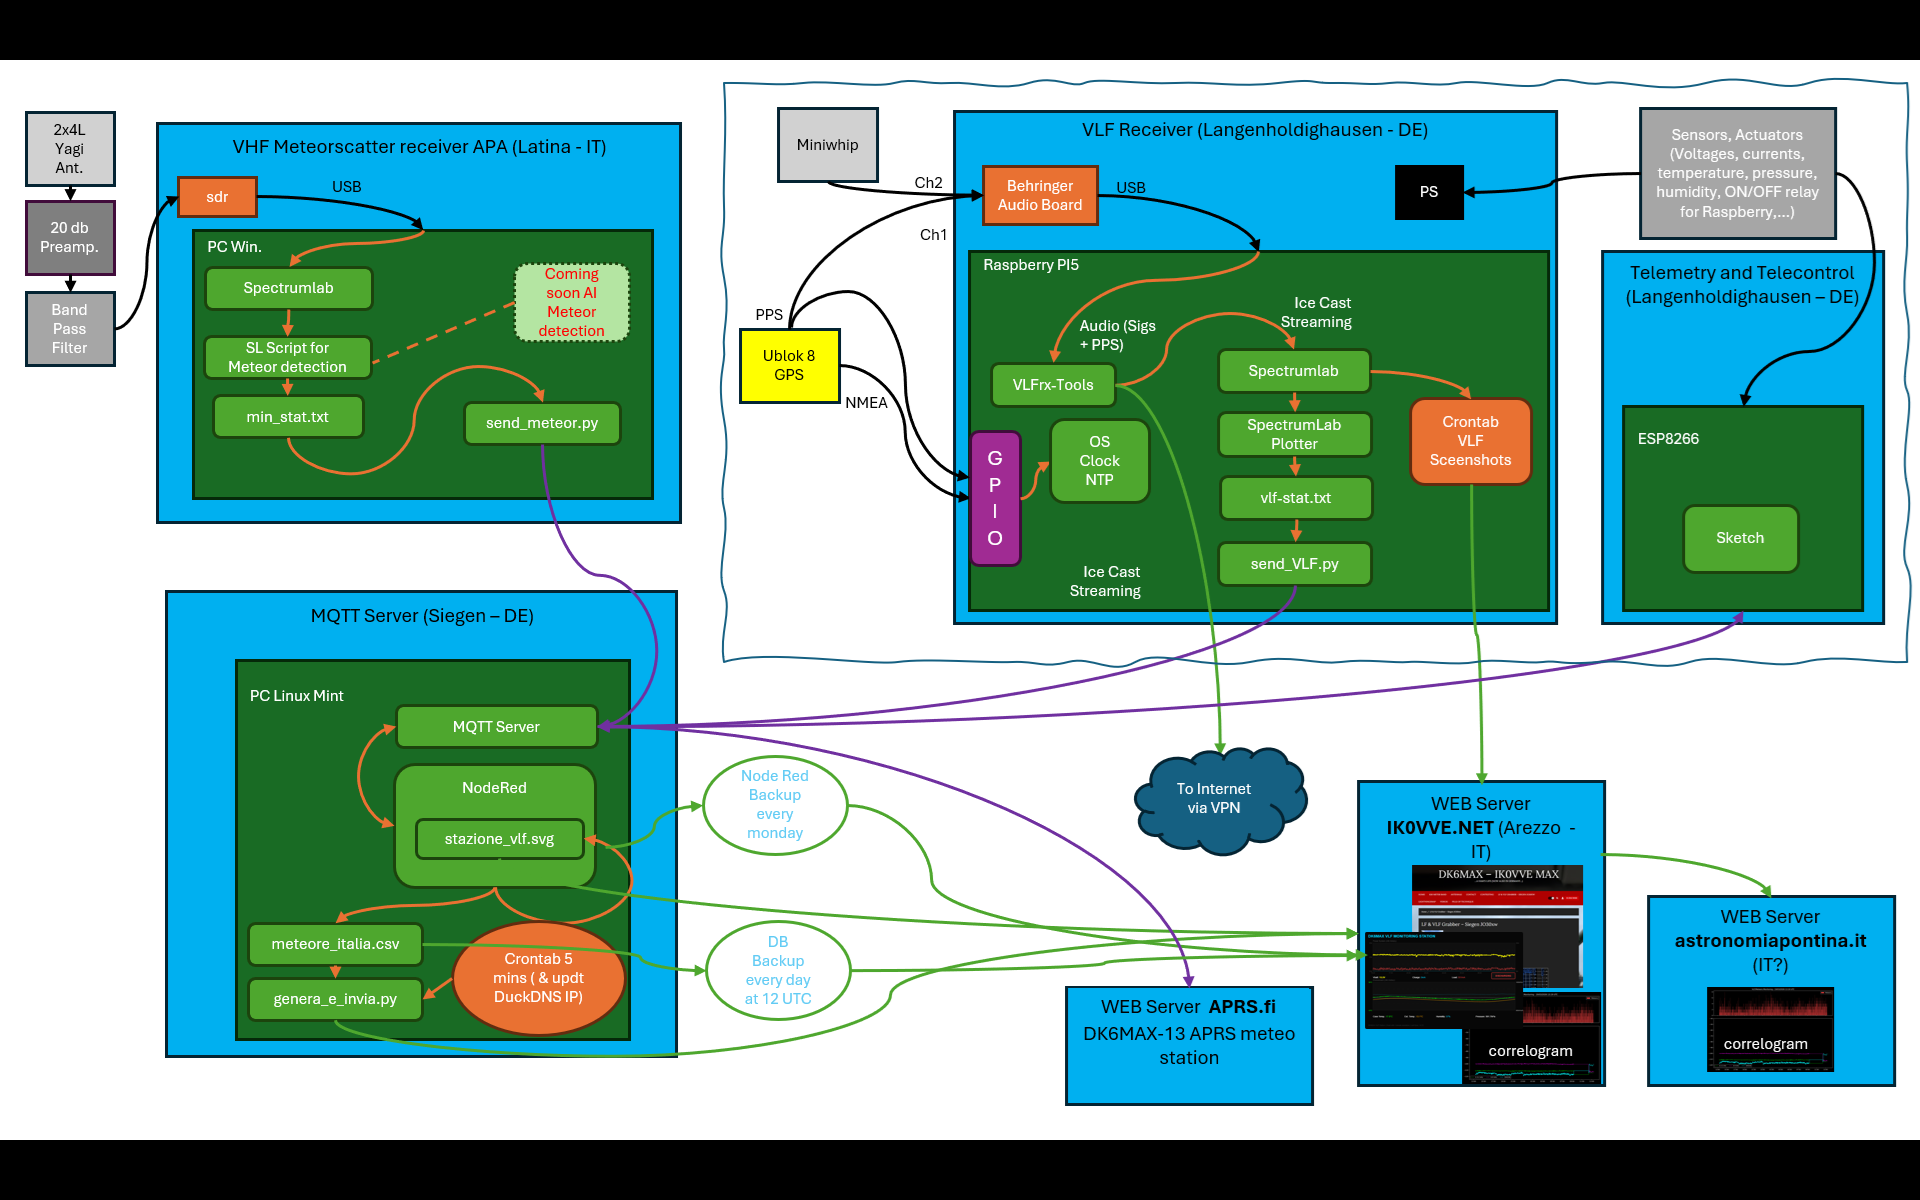
The Core of the New Architecture: ESP8266
The main innovation is the integration of an ESP8266 into the system. This small but powerful microcontroller now acts as the system’s “guardian”:
- Hardware Watchdog: Through direct hardware interfacing, the ESP8266 monitors the Raspberry Pi and can force a reboot in case of sudden freezes.
- Advanced Telemetry: I leveraged the chip’s I/O capabilities to build a complete monitoring system. I can now track real-time solar battery charge/discharge cycles along with environmental parameters: internal case temperature, external temperature, humidity, and atmospheric pressure.
In short, the VLF station has effectively become a precision weather and diagnostic station. Furthermore, all telemetry and weather data are now transmitted over the APRS network and are publicly available on aprs.fi.
MQTT Infrastructure on Linux Mint
All data streams are now interconnected thanks to a dedicated MQTT server running on a Linux Mint micro-PC at my home. This architecture allows me to sort and manage messages from various sensors in a smooth, centralized manner.
However, the most scientifically exciting aspect is the completion of a project I have studied for years: the data correlation system. We are now able to cross-reference VLF background noise anomalies with the number of meteor echoes detected by the VHF station at the APA Observatory in Latina in real-time.
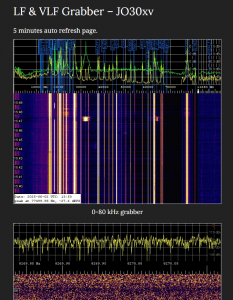
Real-Time Visualization
In the image below, you can see the diagram of the various systems communicating with each other over the internet. It is a complex infrastructure that deserves its own deep dive; therefore, in the coming weeks, I will publish detailed posts about each individual sub-system.
You can check the live results of the VLF and VHF detections directly here: 👉 Real-time data – ik0vve.net (charts are located at the bottom of the page).
A new and exciting adventure begins here.